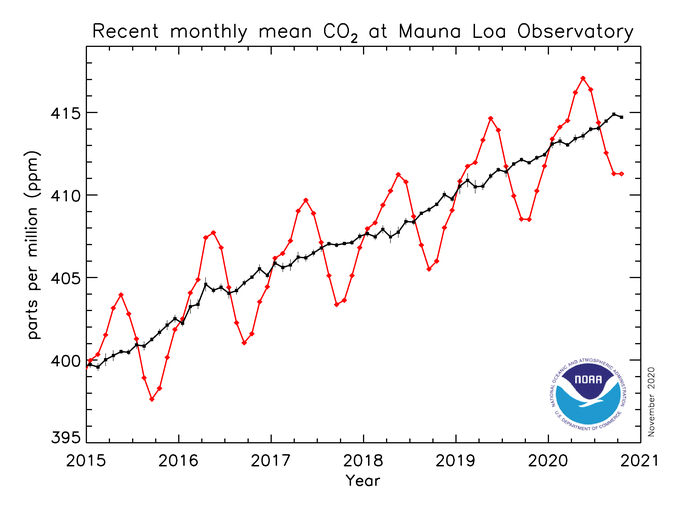
 Updated, November 30, 2020 This is the most recent graph which shows the monthly mean carbon dioxide levels as measured at The Mauna Loa Observatory in Hawaii. The Graph is updated monthly by NOAA. The Graph will also be updated here at www.rapidcooling.net accordingly. Data is reported as a "Dry Air Mole Fraction," The Mole Fraction is expressed as Parts Per Million and is also measured at Barrow, Alaska, American Samoa and the South Pole. The Monthly Average of CO2 in the Dry Atmosphere for October 2020 was 411.28 PPM.
Credit NOAA: ""Mauna Loa Observatory (MLO) is located on the north flank of Mauna Loa Volcano, on the Big Island of Hawaii, at an elevation of 3397 meters, or 11,135 feet above sea level. The observatory is a premier atmospheric research facility that has been continuously monitoring and collecting data related to atmospheric change since the 1950's."" Recent Analysis by Rapid Cooling: The CO2 value as of January 31, 2020 was 413.39 PPM. CO2 increased in value thru May of 2020 where is reach a new High Watermark of 417.07 PPM. Between May of 2020 and October, 2020, CO2 declined by 5.79 PPM. October finished with a CO2 Value of 411.28 PPM. The CO2 value as of January 31, 2019 was 410.83 PPM. CO2 increased in value thru May of 2019 where is reach a new High Watermark of 414.64 PPM. Between May of 2019 and October, 2019, CO2 declined by 5.79 PPM. October 2019 finished with a CO2 Value of 408.52. CO2 increased in Value thru the end of December with a final value of 411.76 PPM. For more Data follow the following Link ESRL's Earth System Research Laboratories, Global Monitoring Laboratory, NOAA From there you can obtain, "The complete Mauna Loa CO2 records" from 1958. to Present. NOAA; Global Greenhouse Gas Reference Network Comments are closed.
|


Science & Data
The Mantra is that CO2 is the Primary Driver of Climate so says Climate Activists like Al Gore, Greta and others. But, here in this section of Rapid Cooling we are going to look at the facts. Unfortunately, for Climate Alarmists the facts are quite clear that CO2 is not your enemy. CO2 in fact, is the Gas of Life! Here, In this Section we will look at Science and Data which is contrary to the argument that CO2 Drives Climate. "In God We Trust, All Others must bring Data" W. Edwards Deming Archives
April 2022
Other Categories |

 RSS Feed