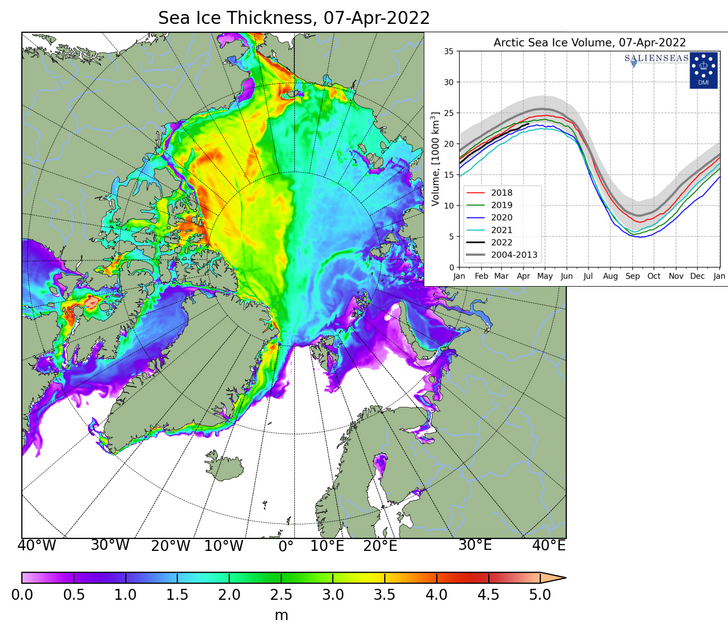
 Source: Danish Meteorological Institute; Modeled sea-ice thickness and volume. The large map shows the sea-ice thickness, while the small figure shows the curves of sea-ice volume in recent years. The gray area around the mean (2004-2013) corresponds to plus/minus 1 standard deviation. Please Treat me to a Cup of Coffee -$5, $10 or whatever you can do. This way I can keep sharing articles, data, information and science regarding Real, Sun Driven Climate Change! Thanks in advance! This data set will be updated around the 7th, 14th, 21st and 28th of each month. The Bottom Map will always be from the corresponding Date in 2004. This is as far back as I am able to attain Maps and Graphs from the DMI and The Polar Portal. The Middle Map will be the approximate half way point between the current Date and the corresponding Date in 2004. The grey band around the climatologic mean value corresponds to plus/minus one standard deviation based on the 10-year average 2004-2013. (Source; Polar Portal, Sea Ice Thickness and Volume) Using these maps one can make many conclusions based on Sea Ice Thickness and Volume over time. Current DATA from The DMI In an up coming article I will be examining past and recent predictions, reality and exactly why Ice Thickness, Thins and how Volume changes over time. If you would like to use the interactive time step at the DMI website here is the link just below. From there you can pick any day or year from 2011 until present day. You may also type in a Date. Please keep in mind that the Month and Day are reversed. http://ocean.dmi.dk/arctic/icethickness/thk.uk.php 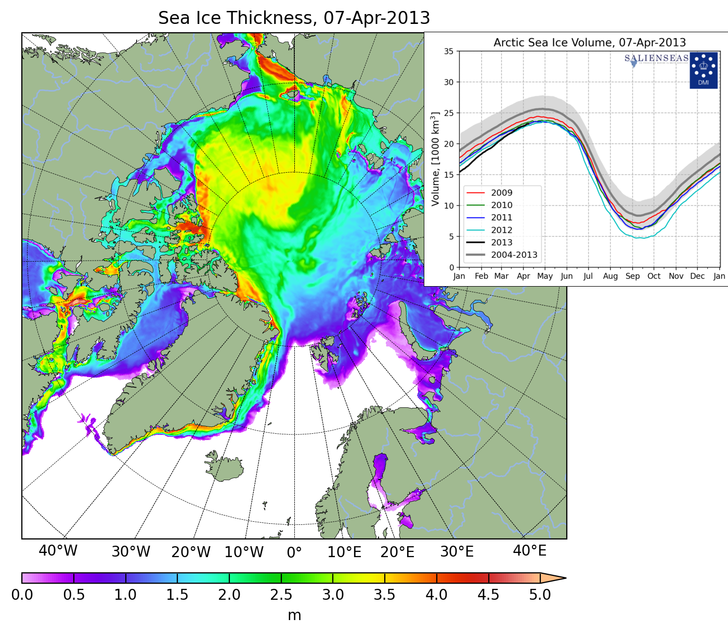 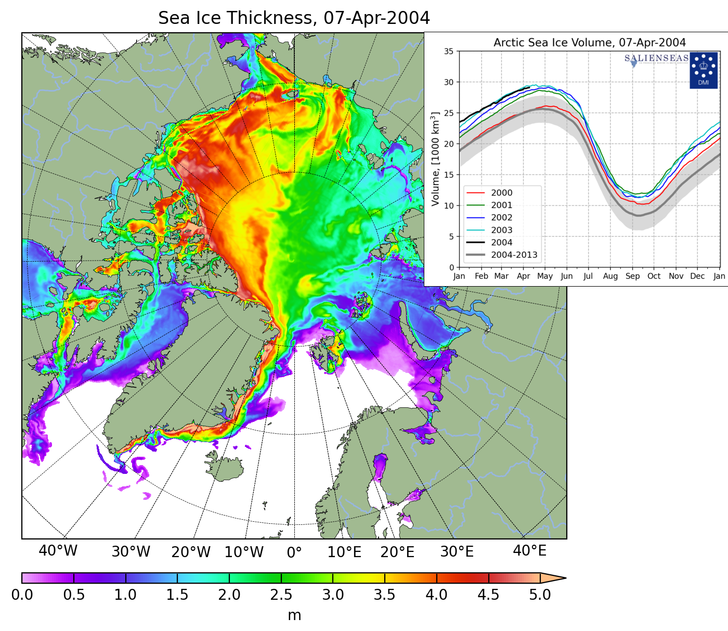 Comments are closed.
|


Science & Data
The Mantra is that CO2 is the Primary Driver of Climate so says Climate Activists like Al Gore, Greta and others. But, here in this section of Rapid Cooling we are going to look at the facts. Unfortunately, for Climate Alarmists the facts are quite clear that CO2 is not your enemy. CO2 in fact, is the Gas of Life! Here, In this Section we will look at Science and Data which is contrary to the argument that CO2 Drives Climate. "In God We Trust, All Others must bring Data" W. Edwards Deming Archives
April 2022
Other Categories |

 RSS Feed